Zonar Systems // Compliance Dashboard
Providing insightful information to make informed decisions
The problem
In order to provide our customers more actionable data, and to be more competitive in the telematics space, Zonar endeavored to move away from static reports of data, and instead create dynamic insights for customers to use. For the first time, Zonar customers would be able to see multiple types of data, at the same time, on the same screen, to help them make more informed business decisions.
My solution
The key to success was to reframe how we viewed our data. I had to remind the team that we weren’t building reports; we were telling stories with data. Rather than think about producing a single report, I challenged our team to focus on the jobs the users were trying to complete. Our goal was to solve our user’s problems before they even knew they had them.
My Contribution
Product strategy
User stories
Usability testing
Visual design
Design documentation
The Old Tools
Sketches are a great way to get buy-in from a client early on in a project. They’re fantastic to help gauge reactions to features themes. They also allow you to take creative risks, since they are so quick and easy to produce.
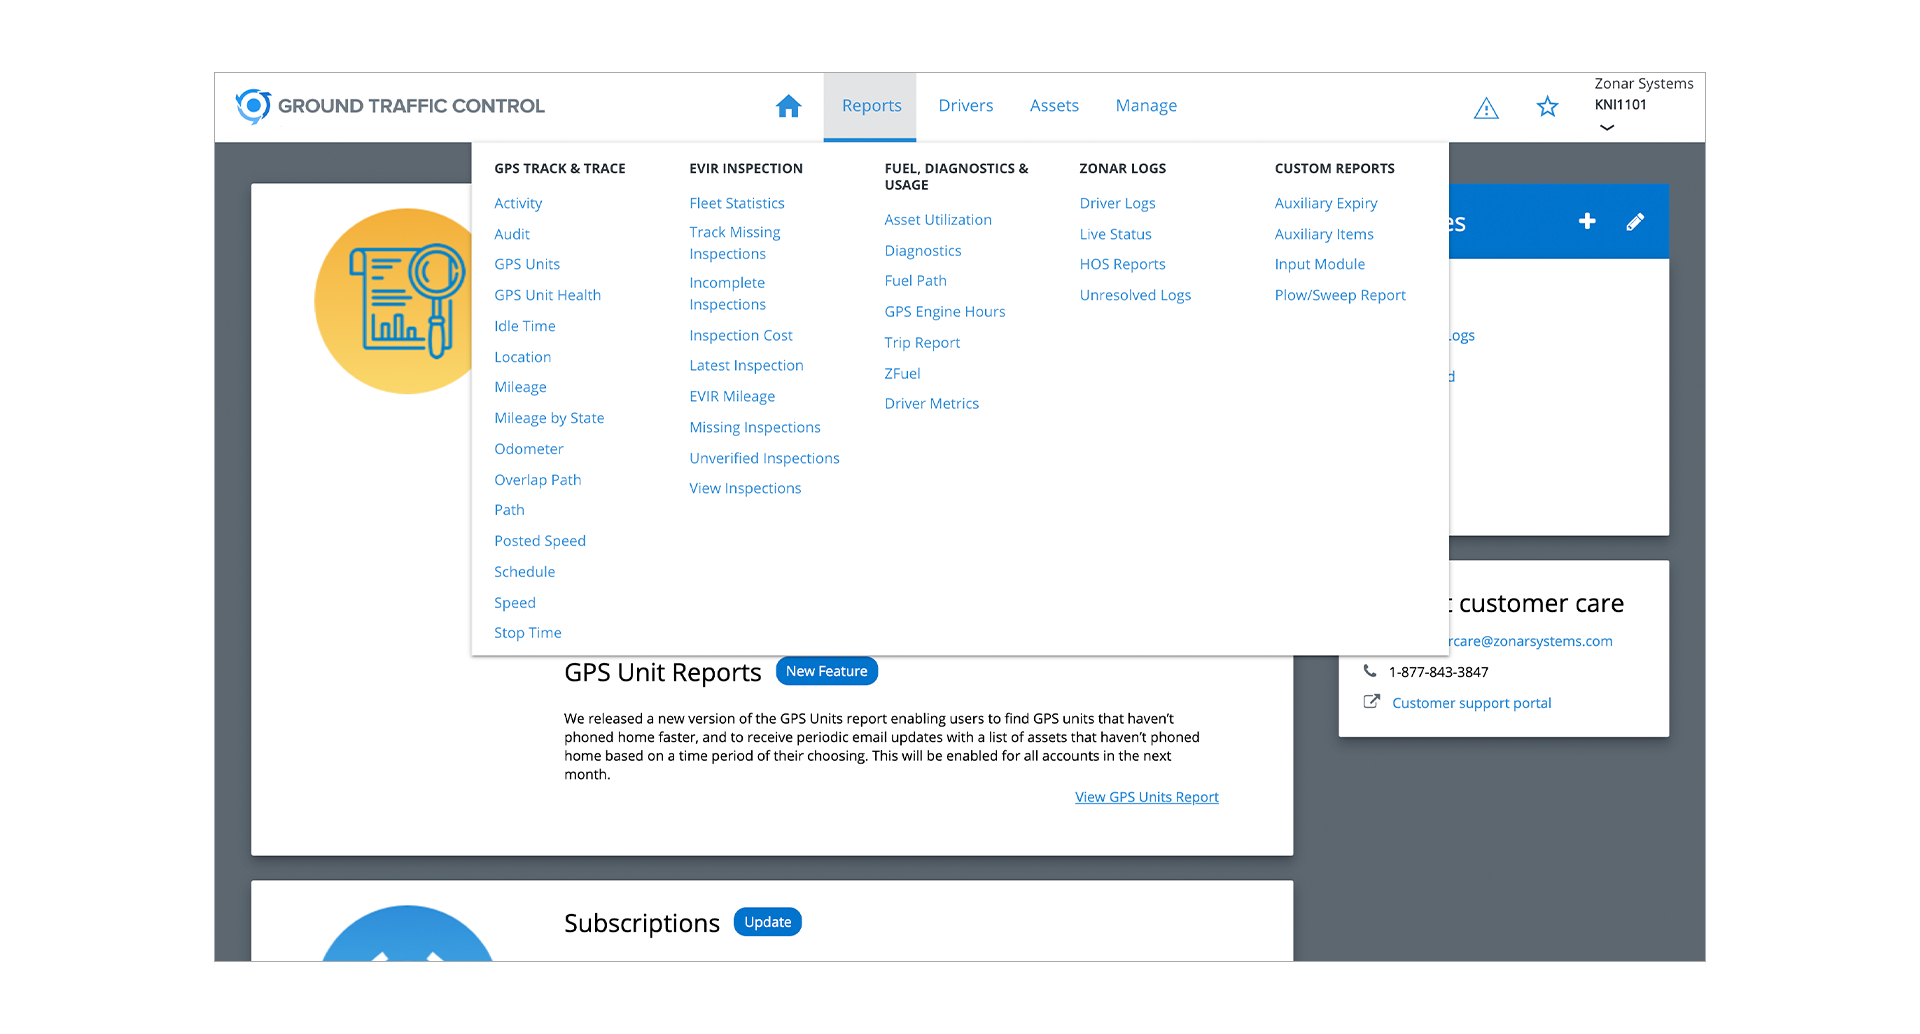
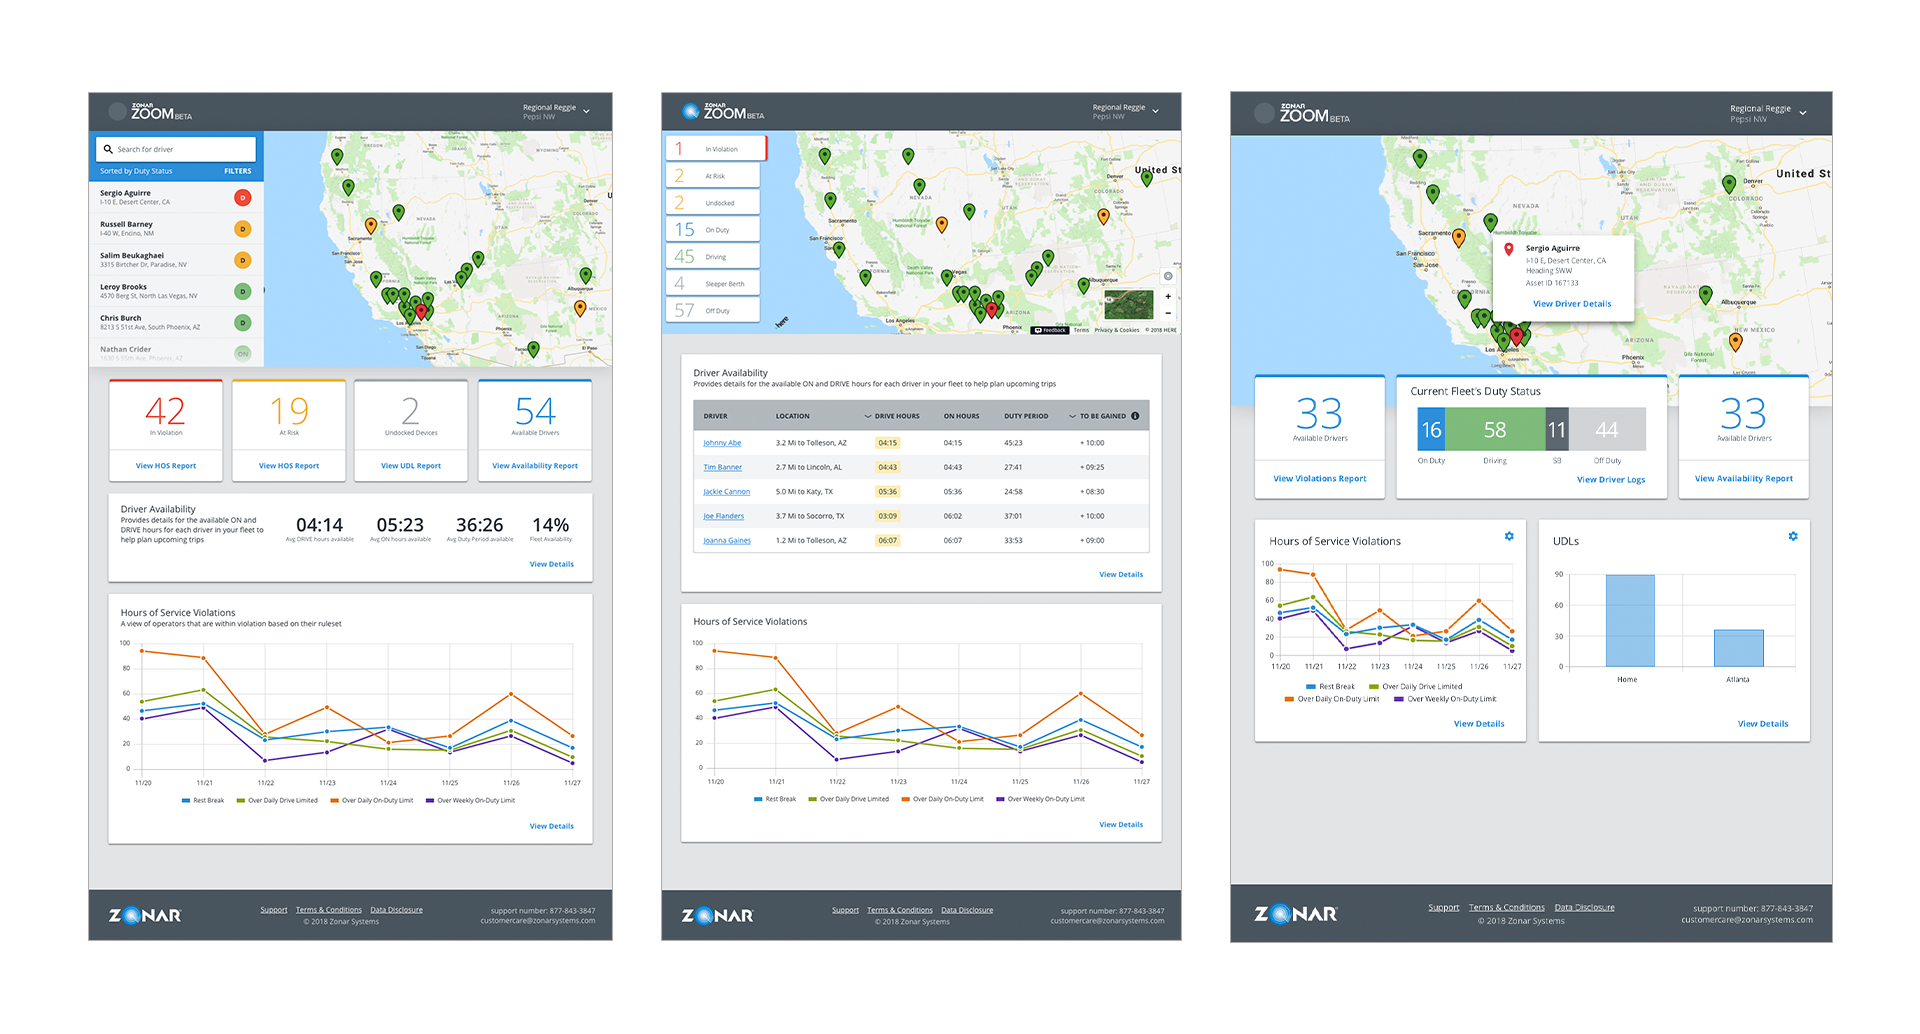
Information customers needed to do their jobs were scattered across multiple reports.
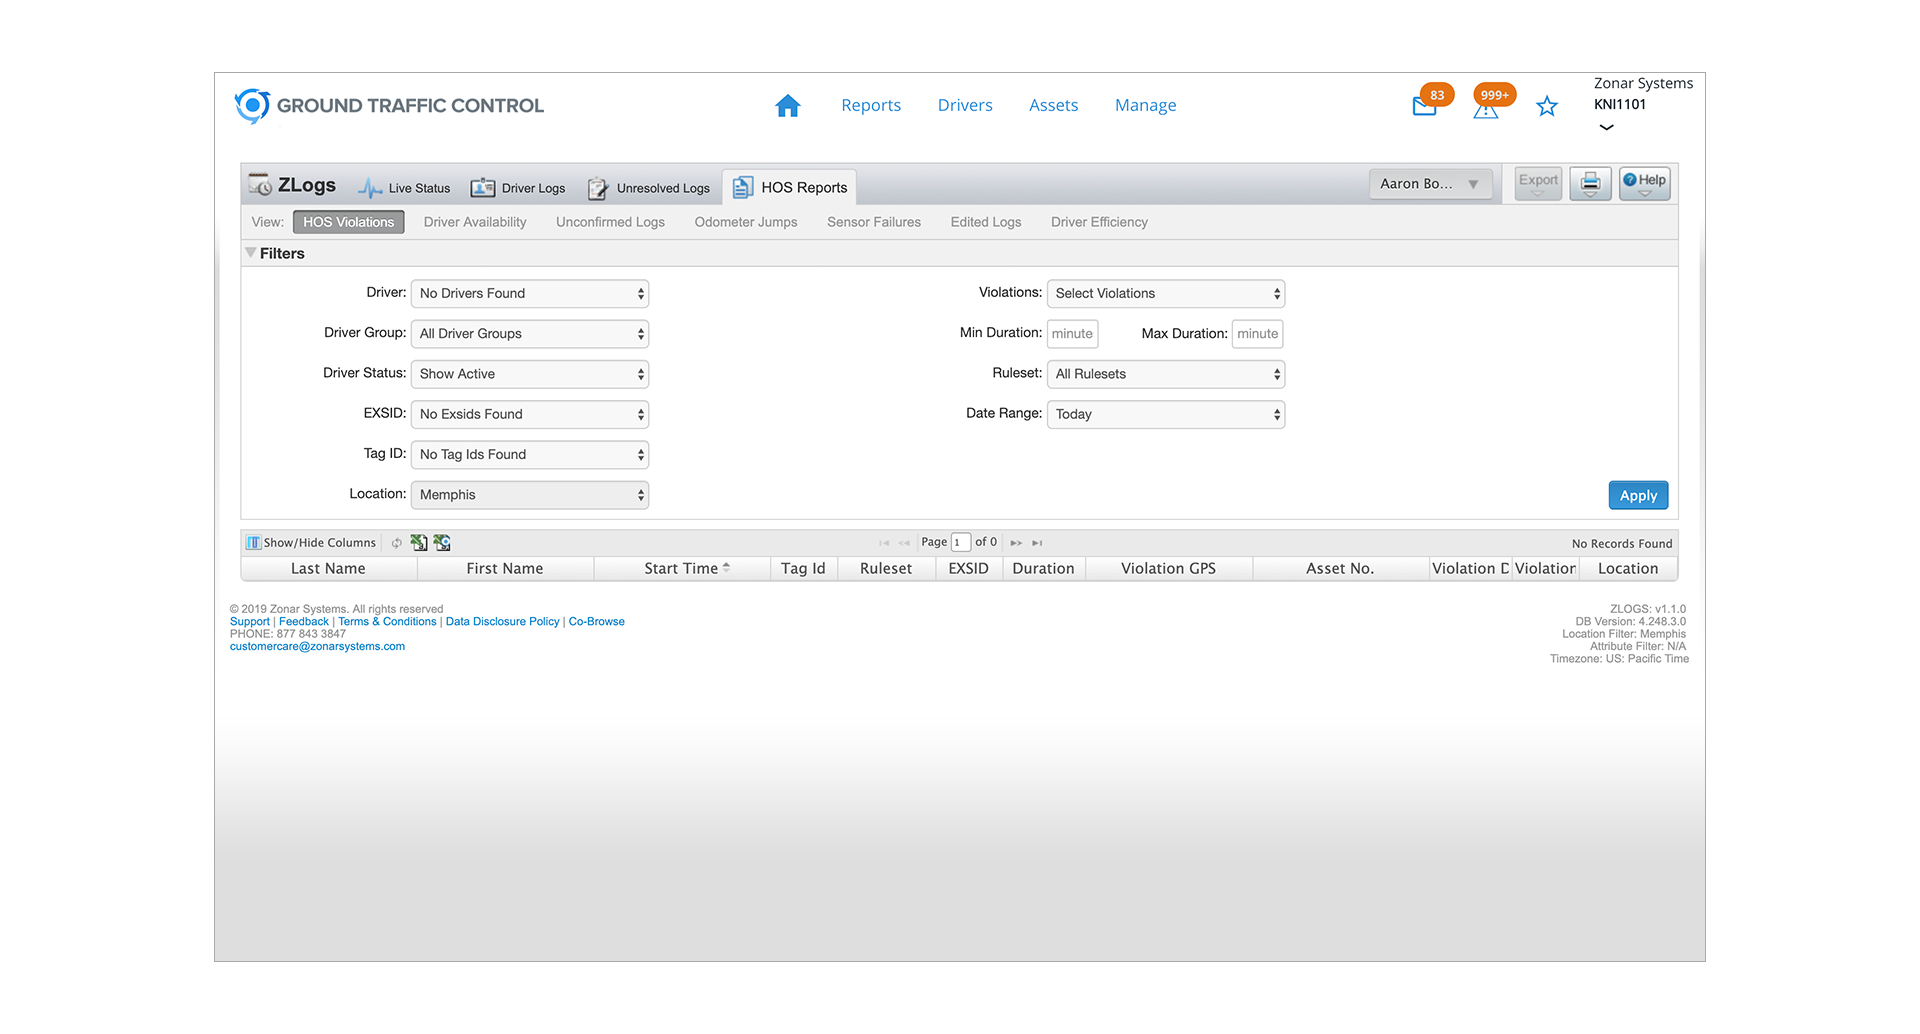
Even after customers found the report they needed, filters needed to be applied before they could see their data.
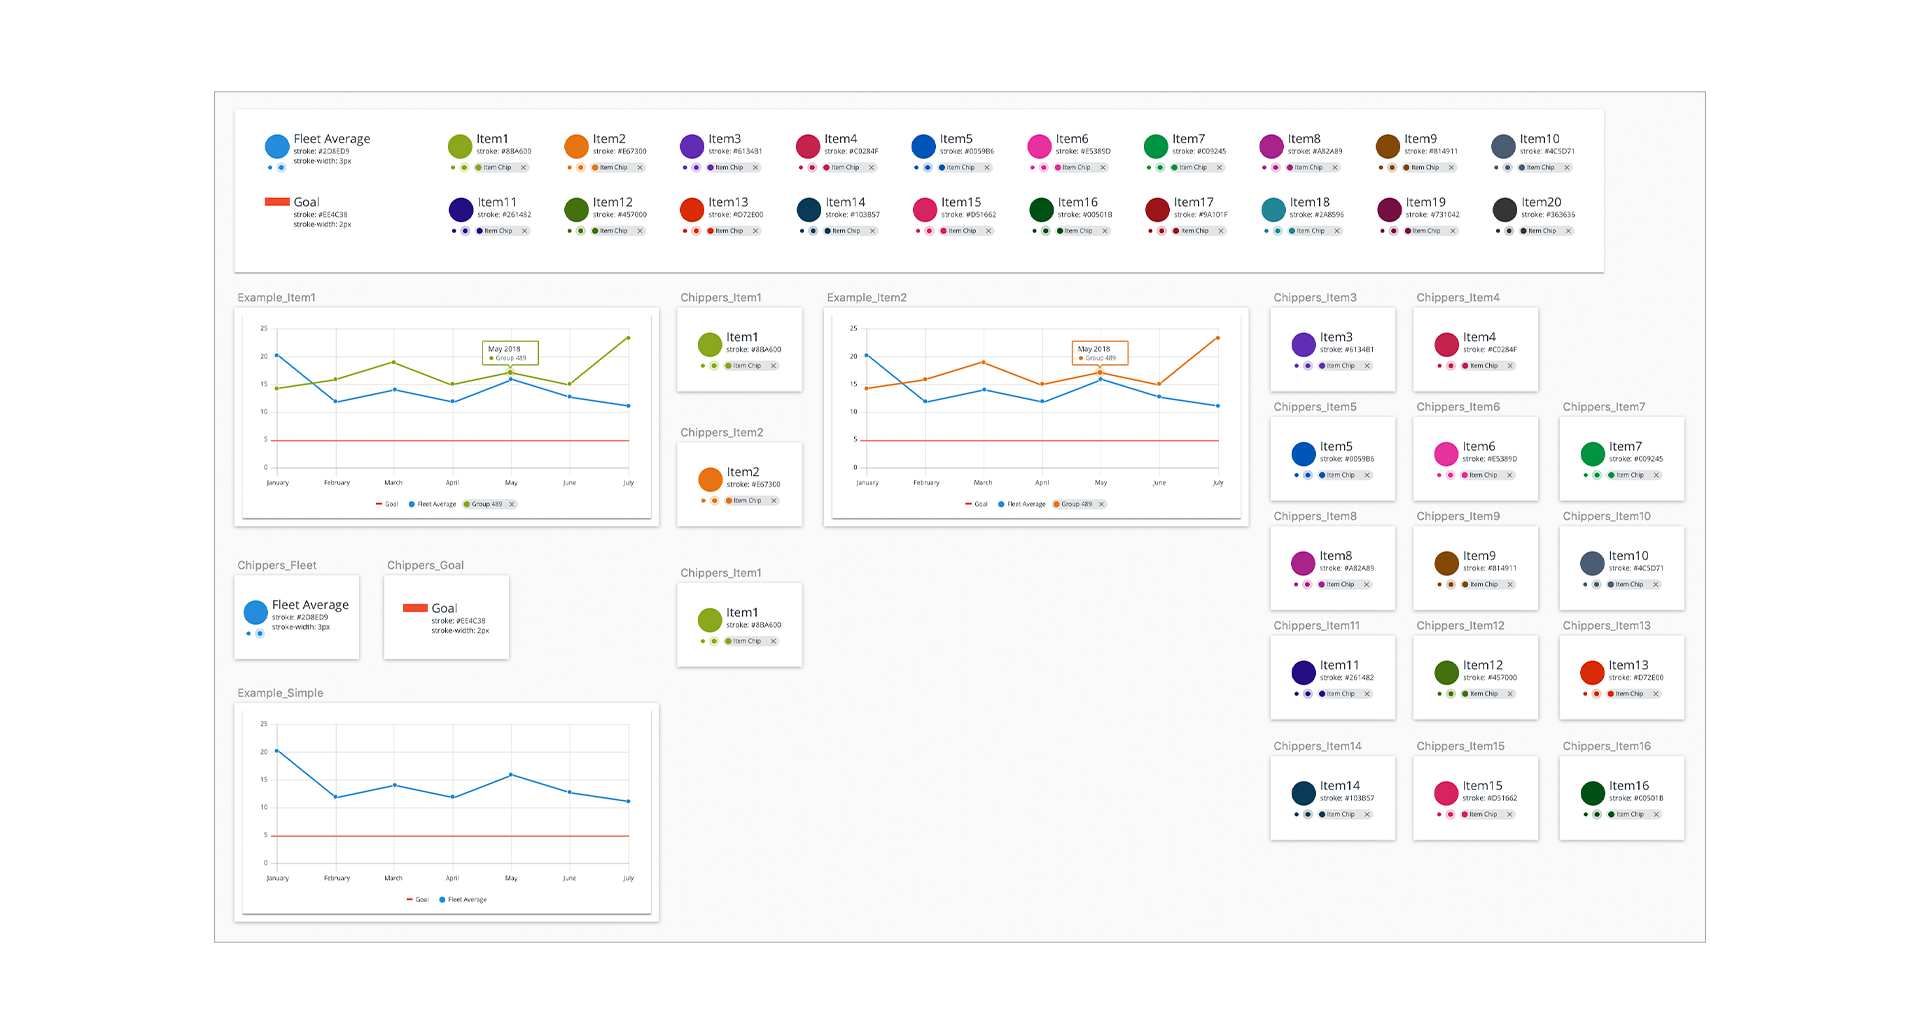
Initial Explorations
Because the application would be so data-heavy, I knew we would require a robust palette of colors for data visualizations and various chart types.
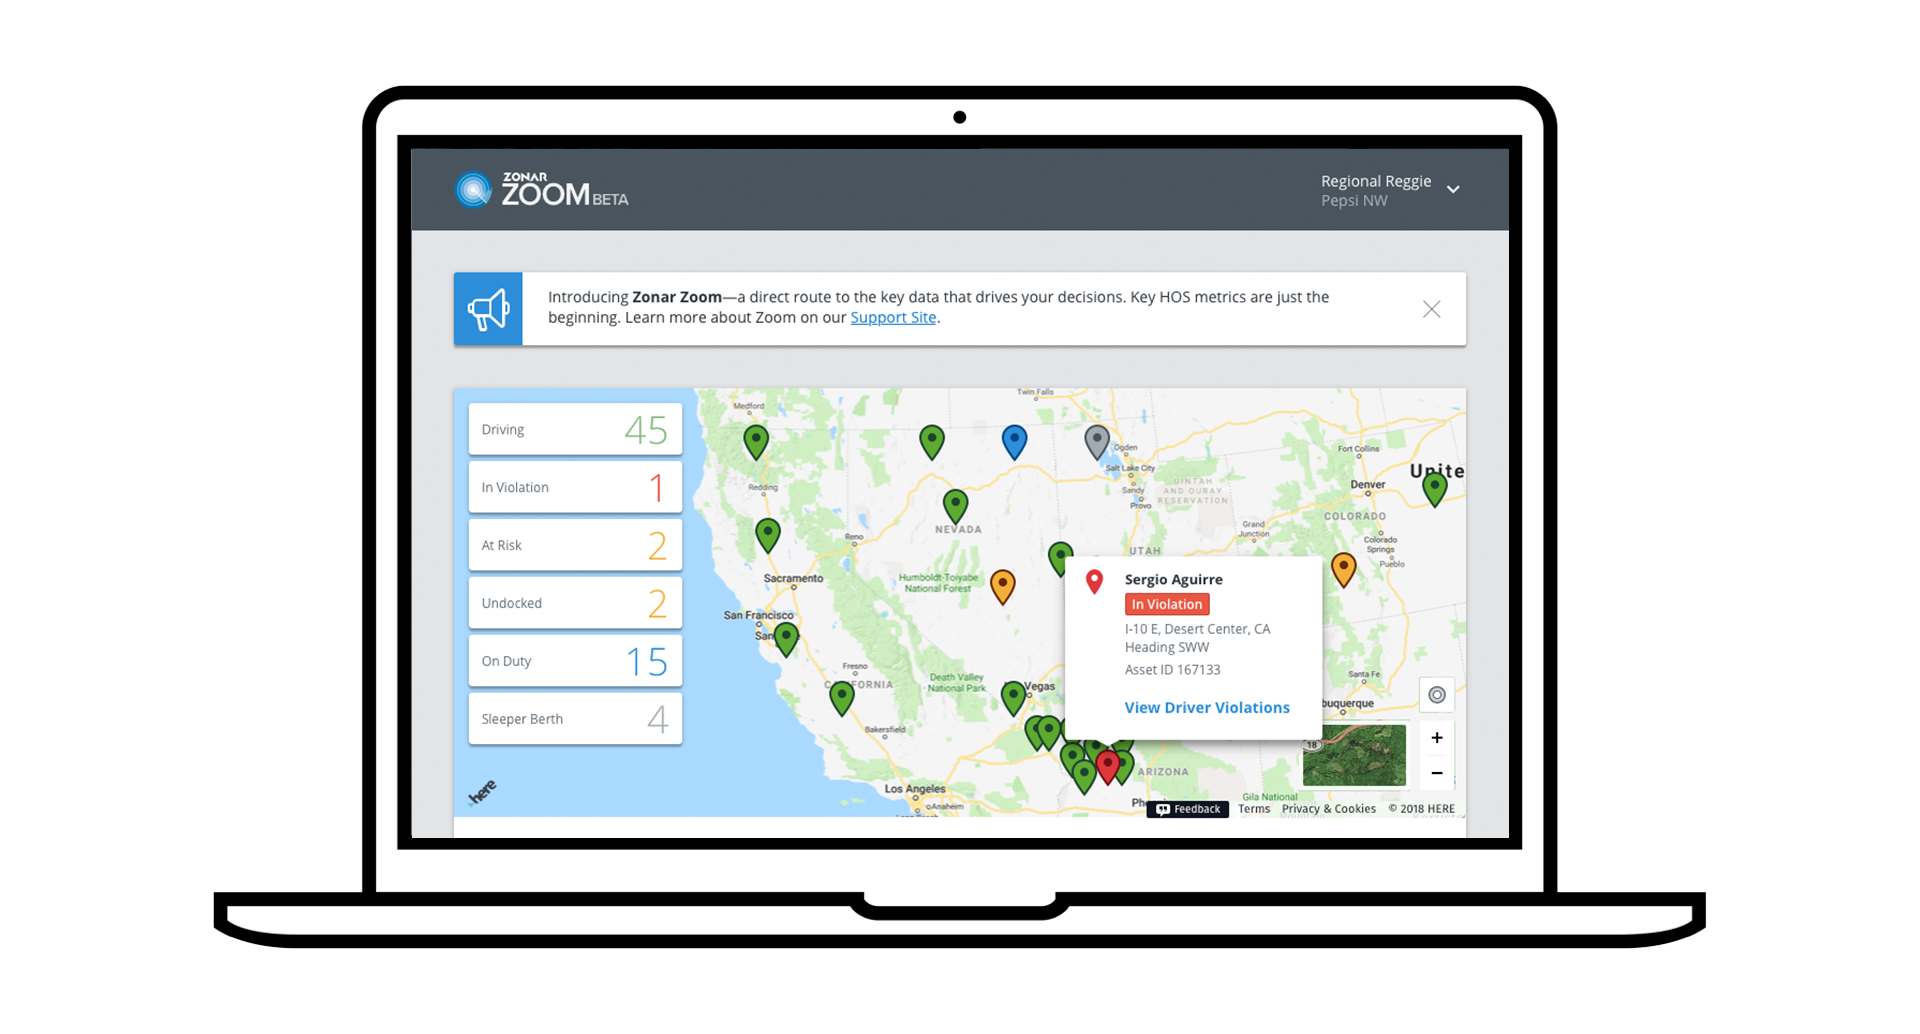
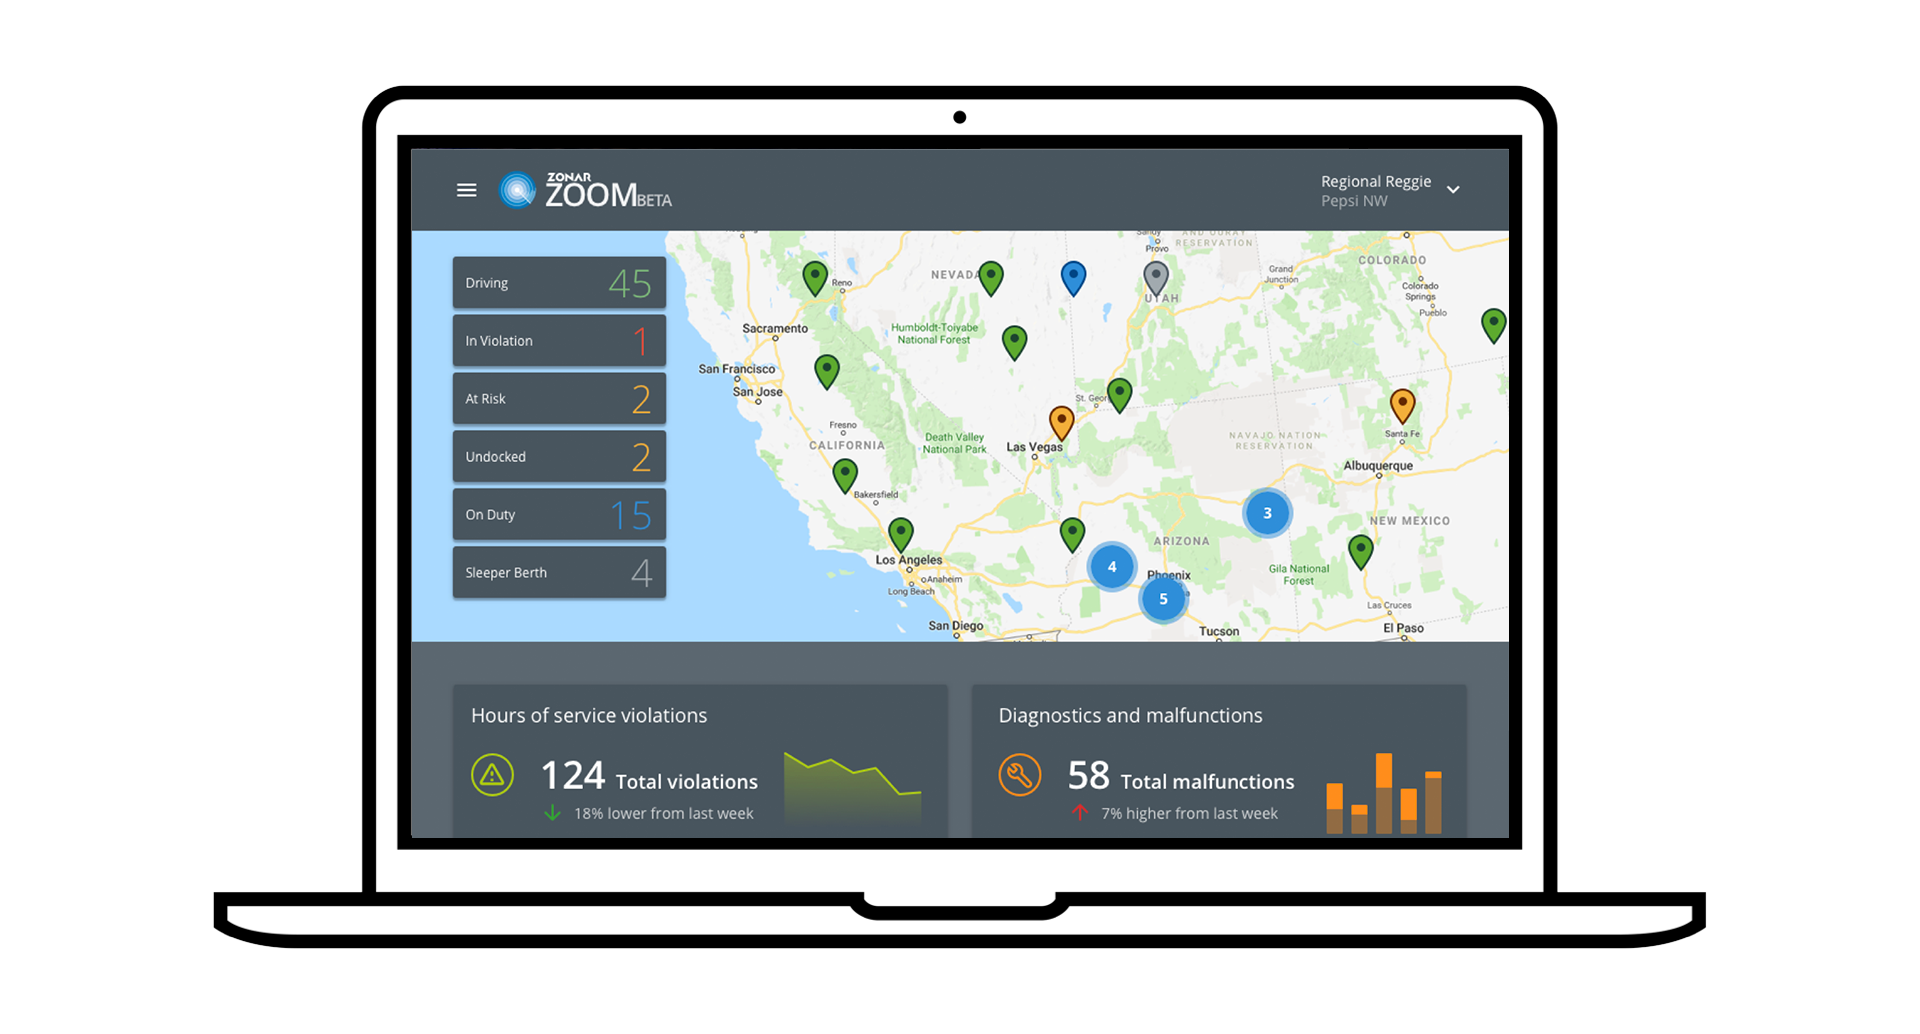
Visual Design
Looking Forward
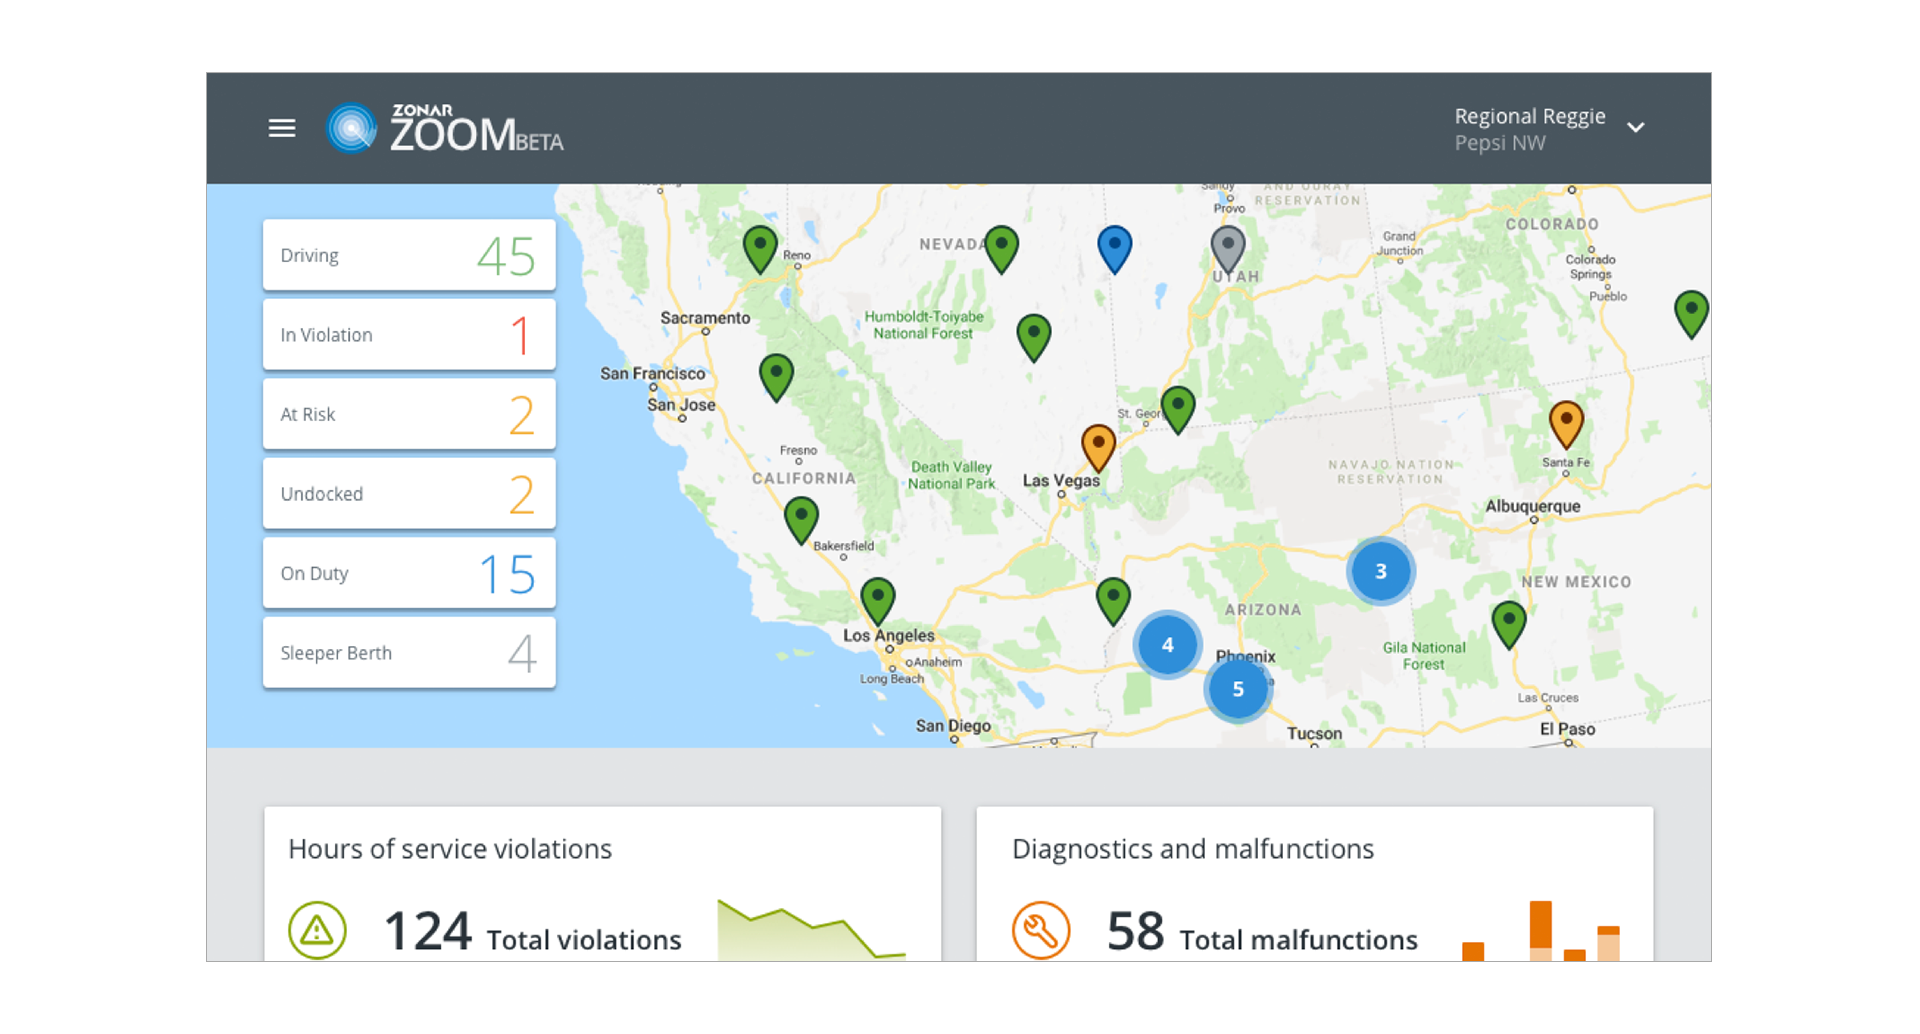
Future iterations of the designs will ensure the Dashboard is as impactful at a glance as possible.
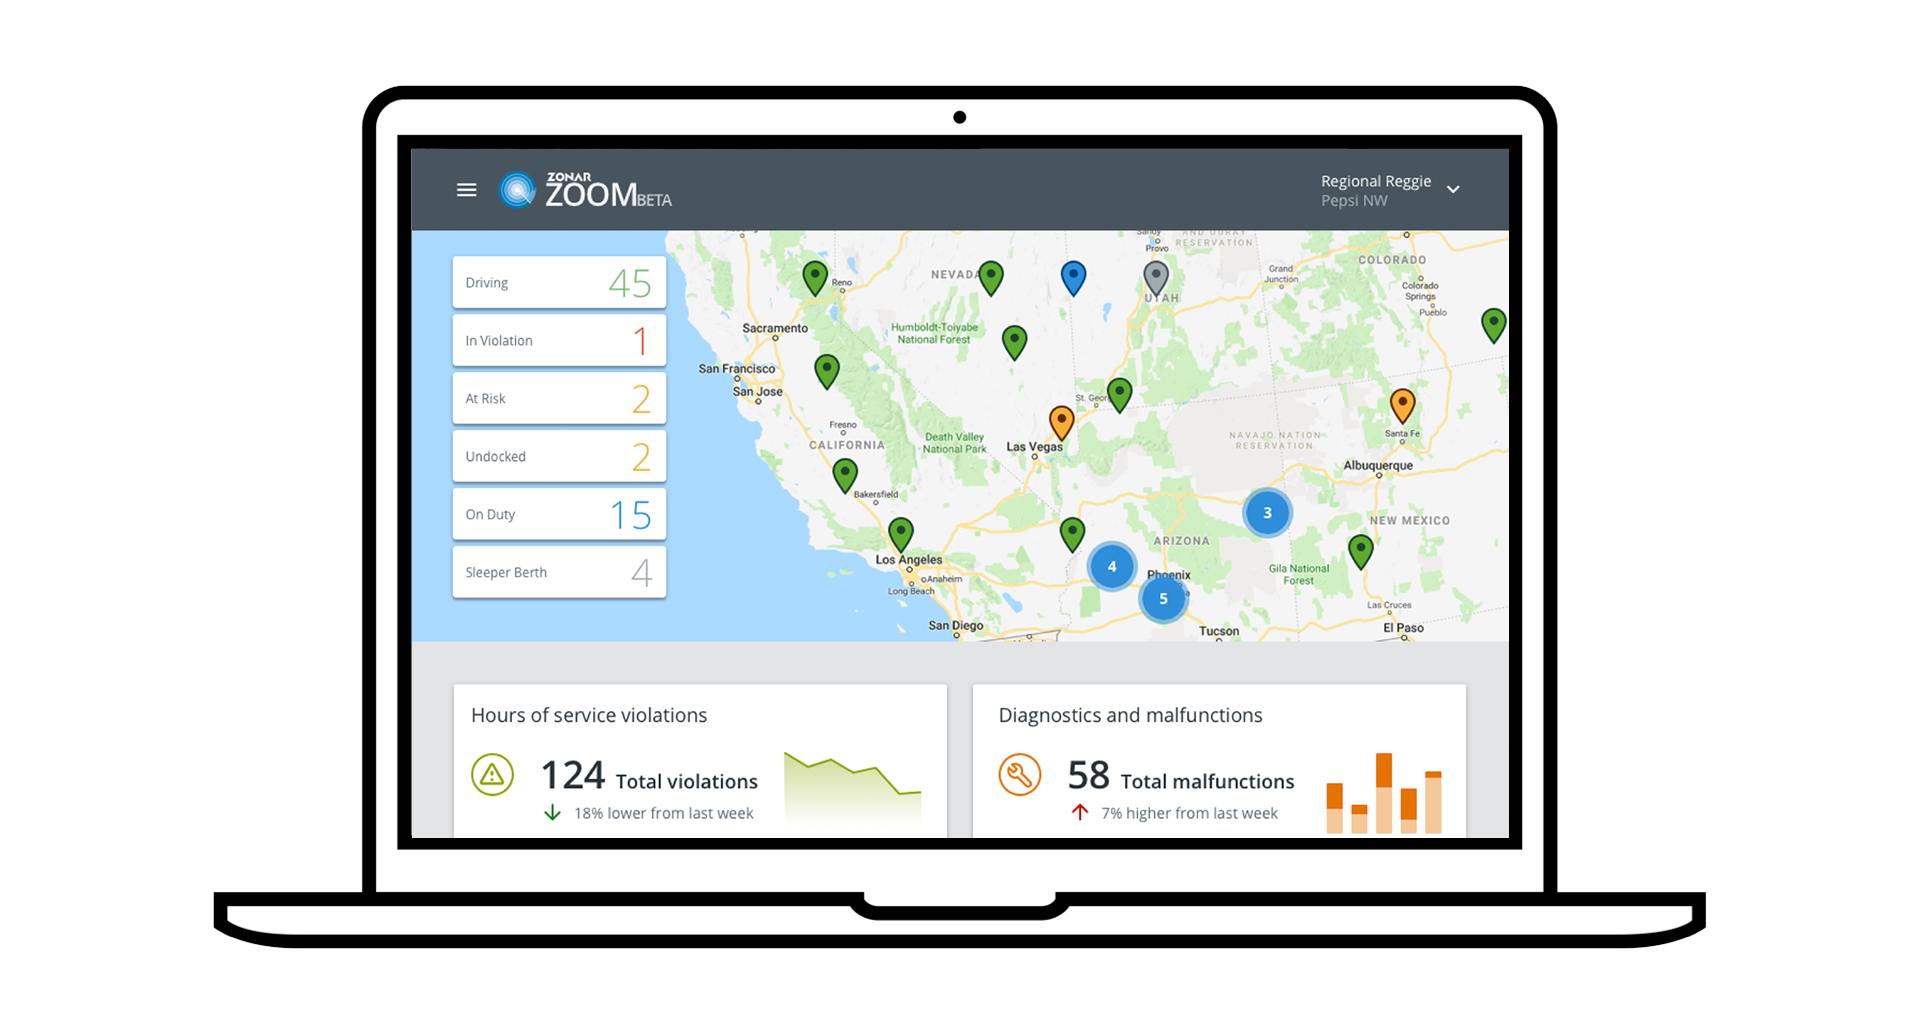
In future versions of Compliance Dashboard, we planned to include features like map point clustering and data trends & insights.
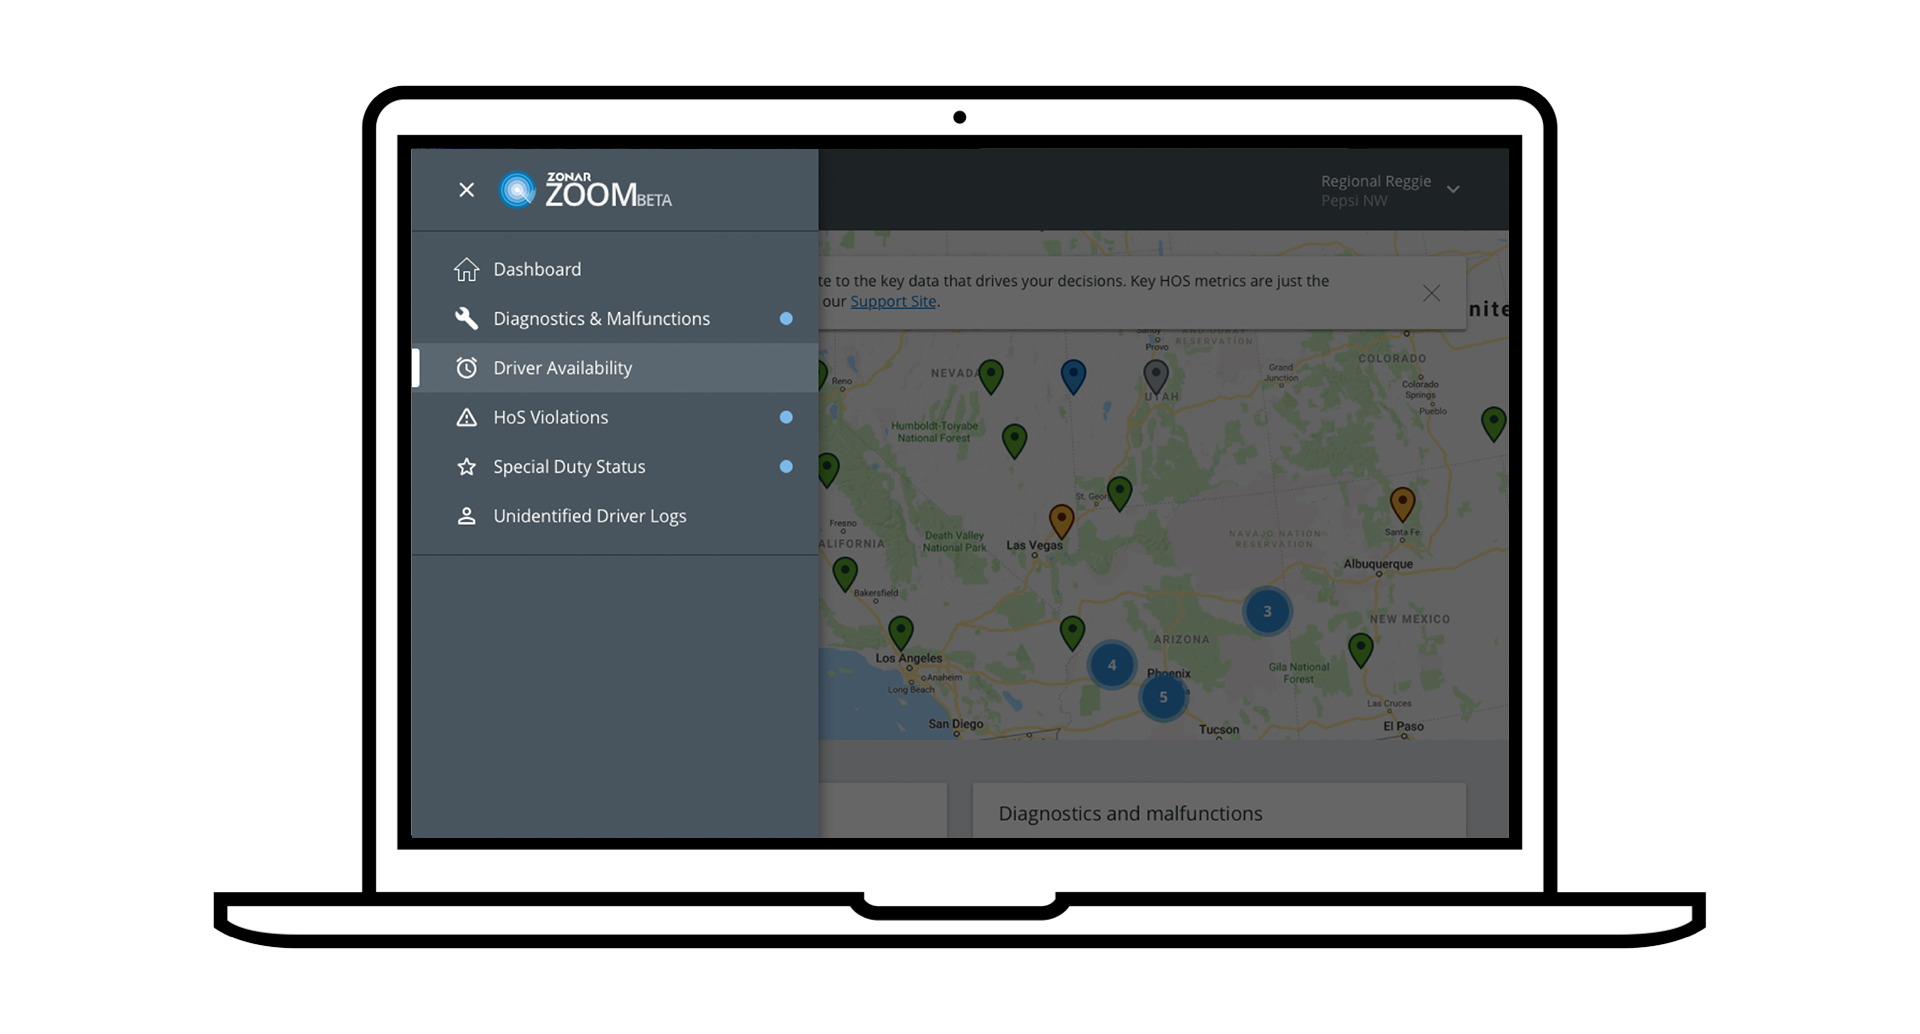
Additional, future reports would roll up into a navigation menu.
We were also working on a dark mode to help eye strain.
Results
More visitors
In the first three months of launching Compliance Dashboard, unique visitors increased 34% compared to the original reports.
More value
Additionally, in its first three months, visitors spent an average of 480% more time in Compliance Dashboard compared to the original reports.